
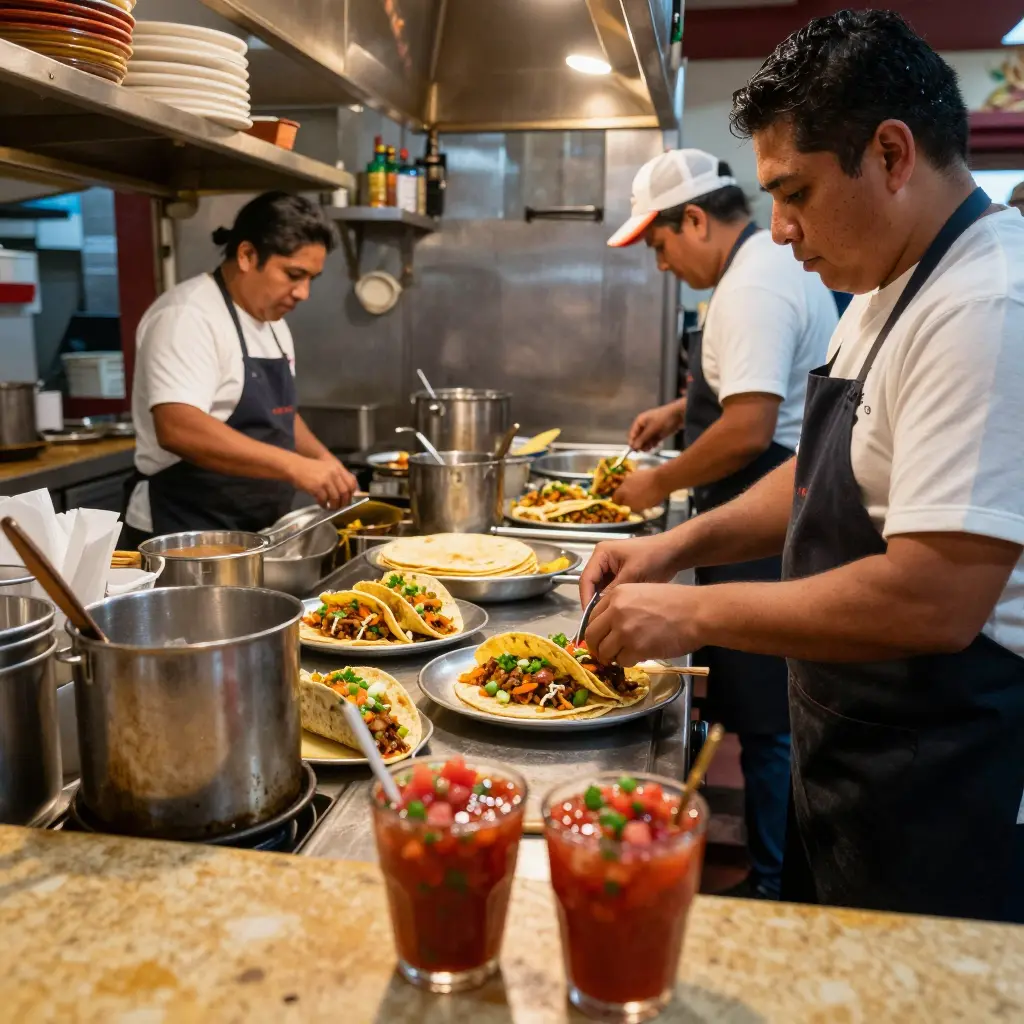
How El Canelo’s Online Pickup Loads Peak During the Dinner Rush
Online pickup at El Canelo doesn’t spread evenly through the evening. Most of it lands in a window far shorter than the posted hours: between 6:15pm and 8:00pm, taco orders, torta orders, and salsa cup counts all crowd in. The pattern repeats on weeknights and weekends. Tacos make up most of the volume, tortas arrive in smaller but heavier-than-average batches, and salsa cup counts rise almost in step with entrée totals.
For anyone running the kitchen, the useful question is how El Canelo Restaurant sequences incoming tickets against what each station can handle. Volume by itself doesn’t explain the bottleneck. When those tickets arrive matters just as much.
Around 7pm the kitchen queue stops clearing. Several large tickets hit the grill, the torta press, and the cold station at once, and salsa cup assembly pulls from the same hands. The limit turns out to be prep, not cooking time.
Quantifying the 7pm Peak
Through the dinner hours, online pickup demand doesn’t rise at a steady rate; it stacks. Across enough weeknights, the incoming ticket rate nearly triples from the early rush to the 7pm crest:
| Time | Tickets per hour |
|---|---|
| 5:30 PM | 18 |
| 6:00 PM | 31 |
| 6:30 PM | 44 |
| 7:00 PM | 58 |
| 7:30 PM | 47 |
Ticket count is only half of it. Average items per ticket climbs at the same time, from 2.1 early to 3.4 at the peak, as dinner parties add tortas and sides to their tacos. Prep time multiplies the load:
- A standard taco order holds the line for about 4 minutes.
- A torta order runs 7 to 9 minutes because of griddle time and assembly.
Multiply the longer tickets by the fuller baskets and the effective workload at 7pm comes to roughly 90 taco-equivalent orders rather than 58. Against the line’s throughput, inbound volume outruns capacity by about 12 tickets every 15 minutes, and the queue stops clearing. That is why online pickup wait times spike and order accuracy slips. Staffing follows the same curve, so the gap between demand and capacity is widest at 7pm. The bottleneck isn’t the busiest hour; it’s the hour the queue can no longer recover from.
Taco vs. Torta Order Data During the Dinner Rush
At El Canelo, the 7 p.m. surge sends online pickup down two production paths. Taco orders move quickly through the grill and assembly line; torta orders lean far harder on the assembly station. For operators studying taqueria kitchen workflows, the table below shows how each category spreads kitchen labor.
| Item category | Share of online pickup tickets | Avg items per order | Avg prep time | Grill vs. assembly load | Salsa cups per order |
|---|---|---|---|---|---|
| Taco orders | 58% | 4.2 tacos | 6.5 min | 70% grill / 30% assembly | 3.1 cups |
| Torta orders | 42% | 2.1 tortas | 9.2 min | 35% grill / 65% assembly | 1.4 cups |
| Blended dinner-rush average | 100% | 3.3 items | 7.6 min | 55% grill / 45% assembly | 2.4 cups |
Caption: How taco and torta orders spread kitchen labor across the grill and assembly stations during the 7 p.m. pickup rush, with prep time and salsa cups per order.
What the Taco and Torta Numbers Show
| 7 PM Metric (per hour) | Taco Orders | Torta Orders |
|---|---|---|
| Tickets | 41 | 18 |
| Avg items per ticket | 4.2 | 2.1 |
| Avg assembly + warming (sec) | 38 | 95 |
| Salsa cups per ticket | 3.2 | 1.4 |
| Total salsa cups | 131 | 25 |
| Station touches per order | 2 | 5 |
The table sets volume against effort, and the two columns don’t line up. Taco orders win on count, roughly 41 tickets an hour at 7 PM against 18 torta tickets, but each taco ticket is small, fast, and light on the line. At about 38 seconds of assembly and two station touches, the griddle and expo keep up with taco orders almost as fast as they arrive.
Torta orders run the other way. They arrive less often, but each one takes around 95 seconds of assembly and warming plus five station touches: the bread is toasted, the fillings are layered, and the finished torta waits in the warmer. A handful of torta orders ties up a cook and a station far longer than a burst of taco orders on any high-volume taqueria floor.
Salsa cup counts widen the gap. Taco orders produced 131 cups an hour; torta orders produced 25. Each cup still needs a scoop, a lid, and a label, so taco volume keeps the salsa station busy even though it leaves the warmer alone.
The queue forms first at the torta and warming station, where tickets stack into a line that can’t accelerate. Then, as taco volume peaks, the expo rail backs up behind the salsa station. Once the warming station saturates, order fulfillment stalls for taco and torta orders alike.
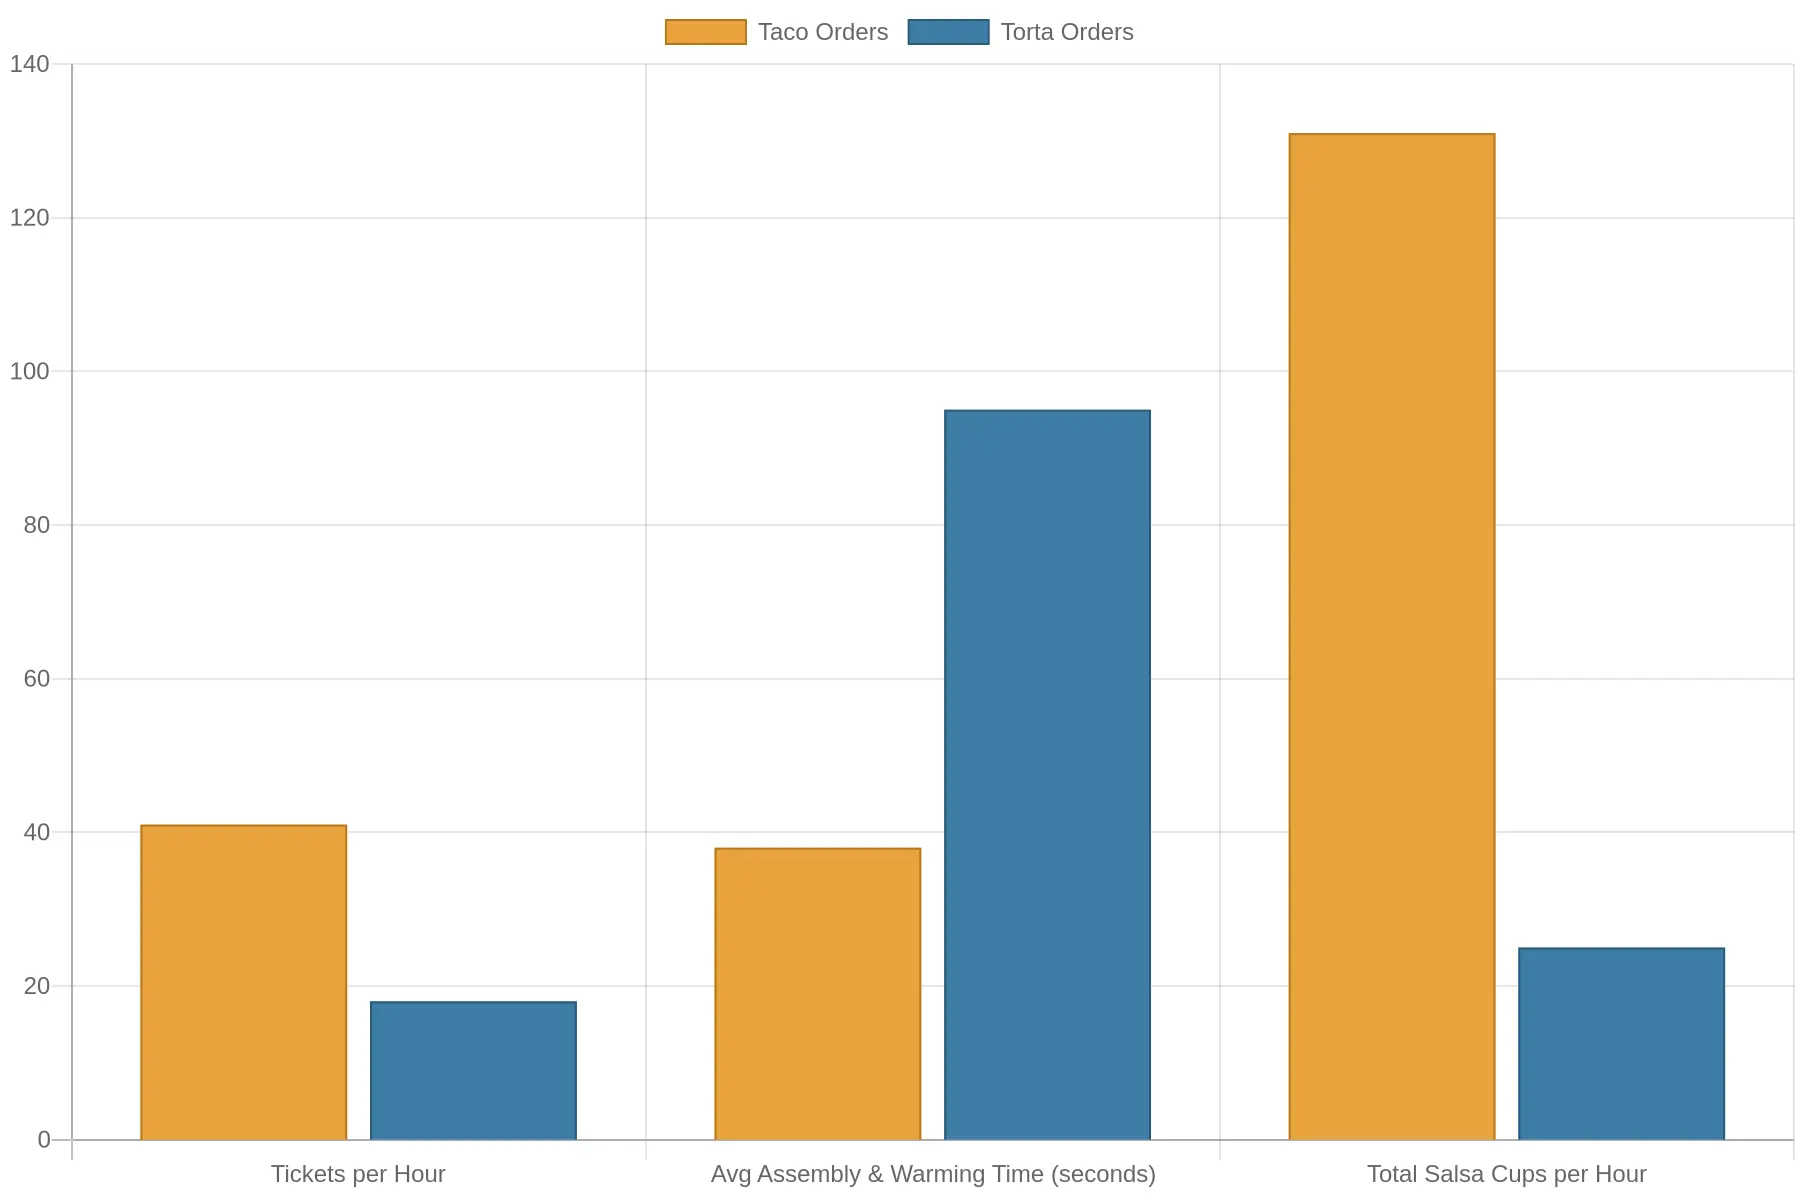
Online pickup orders at El Canelo don’t arrive evenly across the dinner window; they surge around 7 PM, and that hour reshapes the whole kitchen line. The page on El Canelo’s online pickup operations breaks down how the load is distributed.
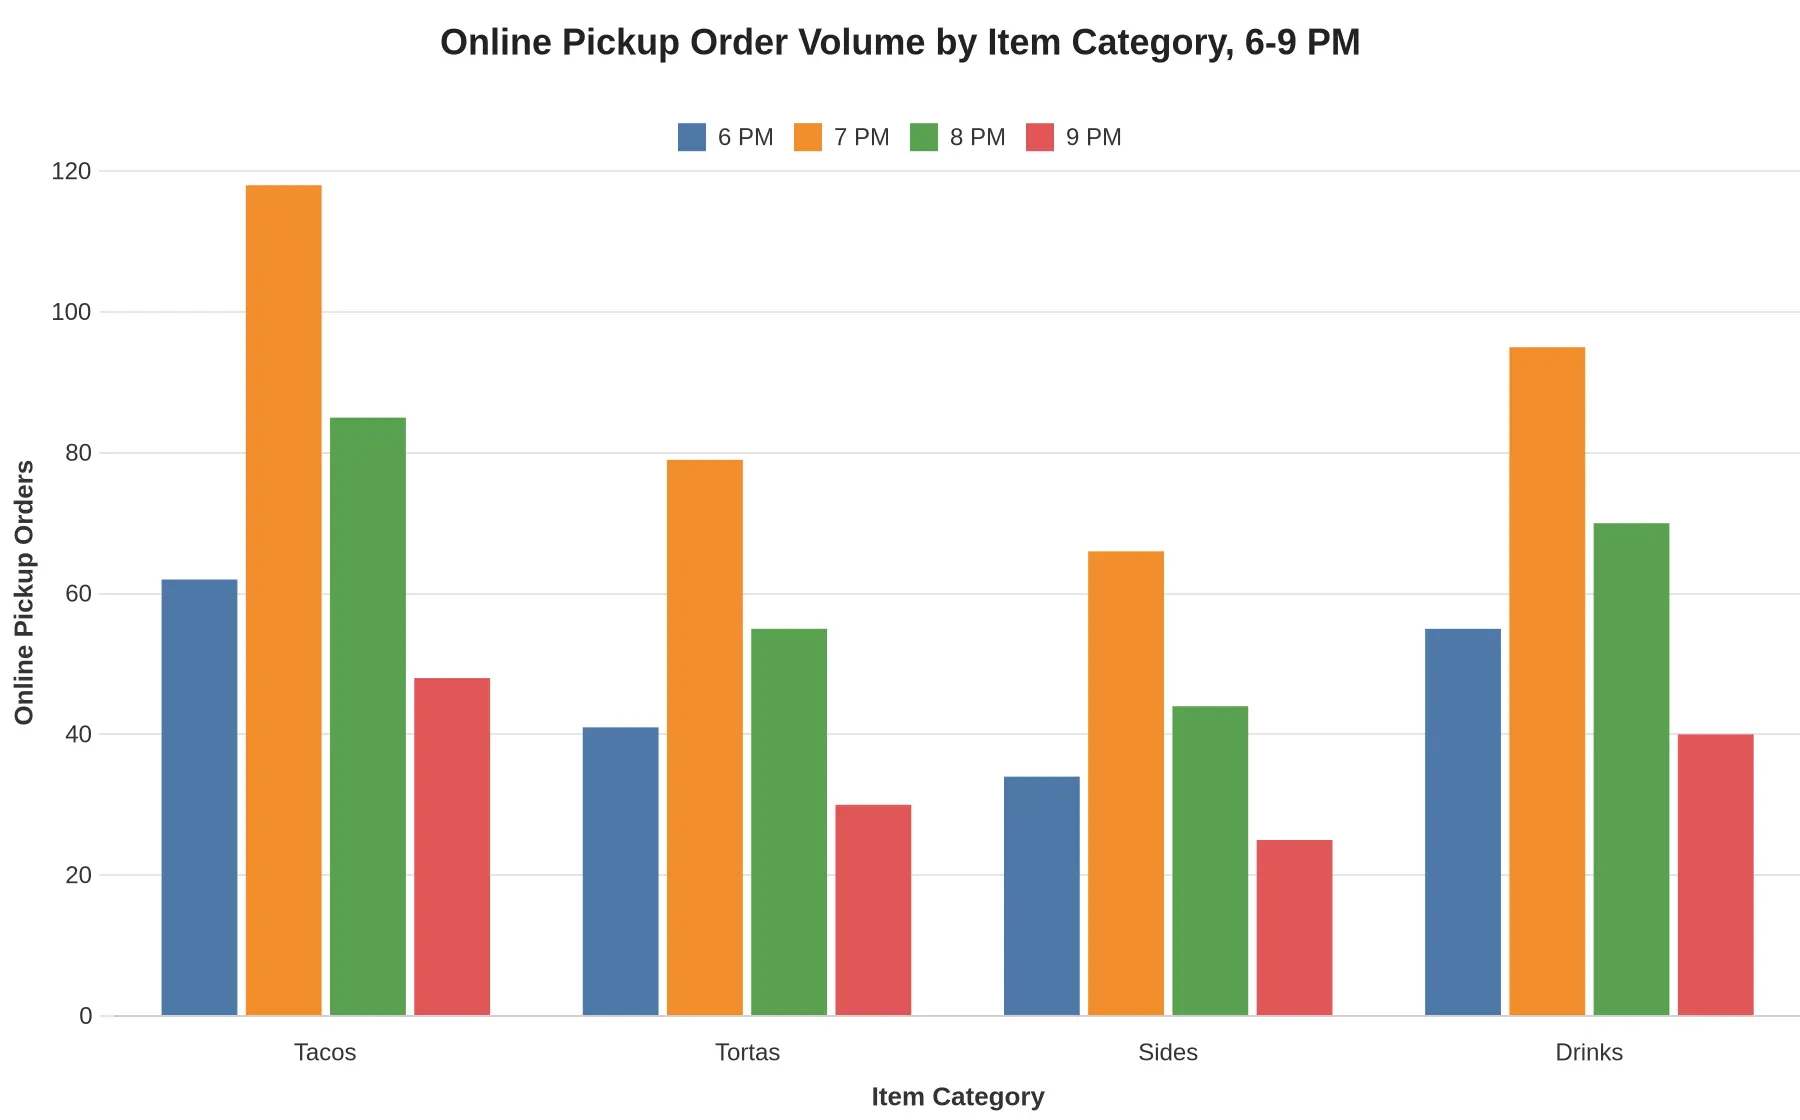
Caption: Tacos (118), tortas (79), sides (66), and drinks (95) all peak in the 7 PM slot, the same hour the kitchen queue stalls.
Salsa Cup Counts and Their Hidden Operational Cost
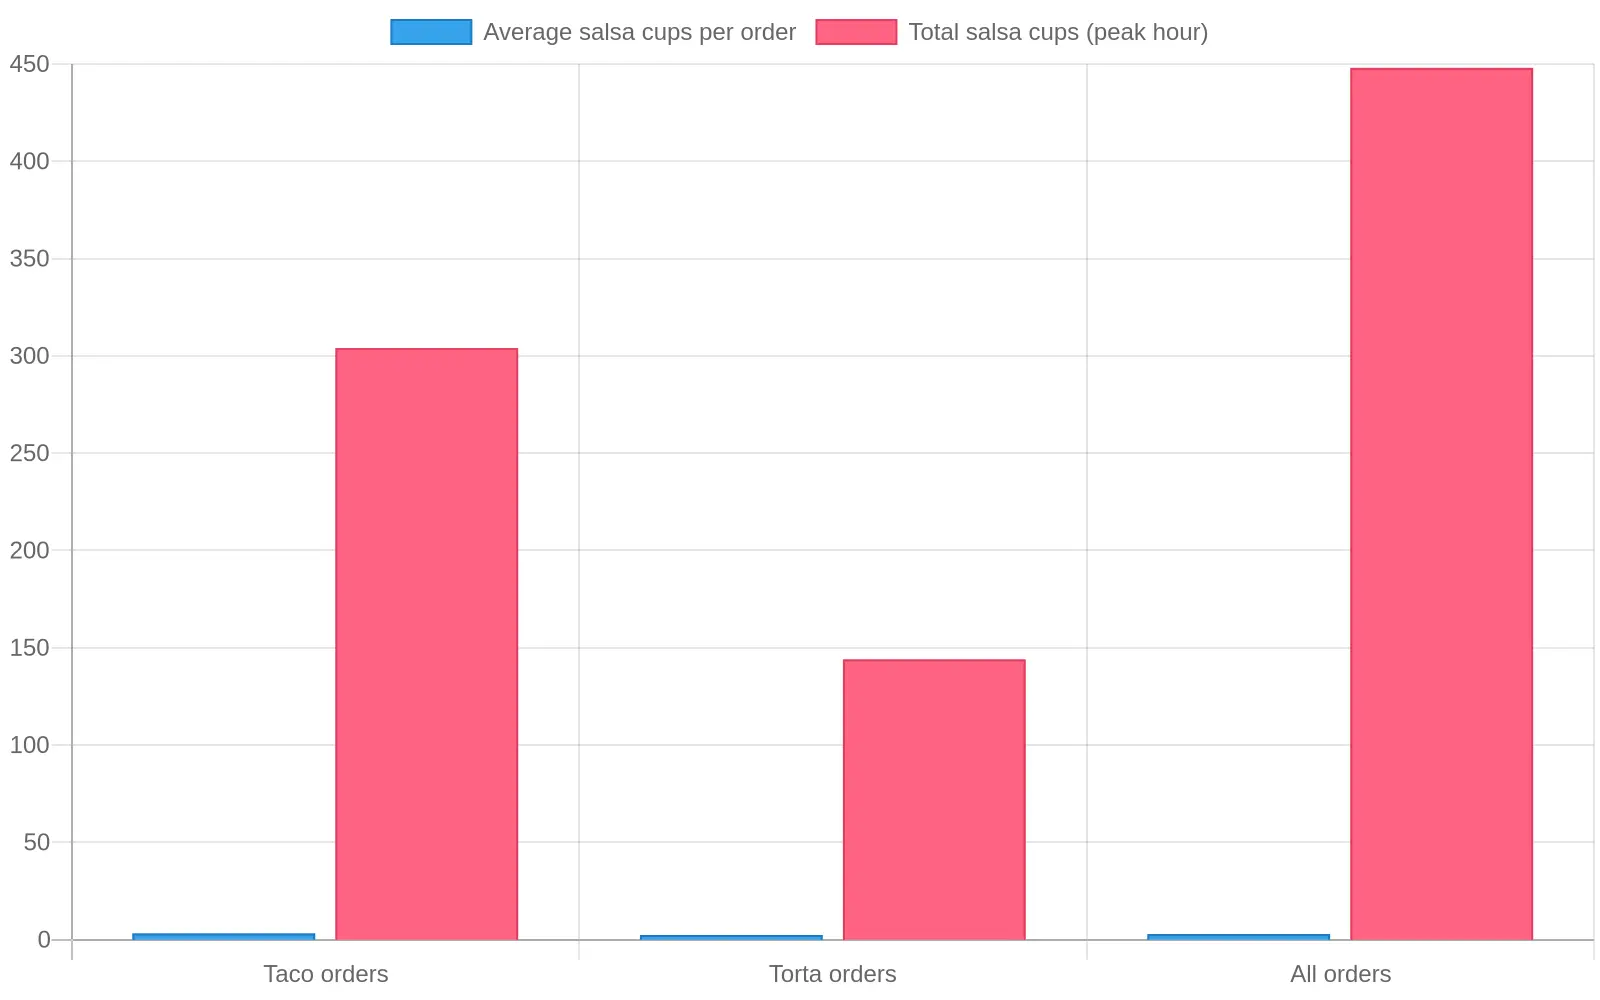
Salsa cup counts rarely show up on an operations dashboard, but at El Canelo they shape the 7 p.m. rush. Every online pickup ticket carries salsa, and the cups add up faster than most managers expect. Taco orders average 3.2 cups apiece; torta orders average another 2.4, since guests rarely stop at one flavor. On their own they look like rounding errors. Across an hour they become the bottleneck.
At the peak, the kitchen fills roughly 95 taco orders and 60 torta orders, or about 448 salsa cups in an hour. Each cup needs a lid, a label, and a slot in a bag. Portioning, sealing, and sorting takes 4 to 6 seconds per cup, which adds up to 30 to 45 minutes of assembly labor at the point when the stations are already full. On a taqueria order fulfillment line the same thing happens: the queue stalls at the salsa station before it stalls at the grill. Cups delay every handoff downstream.
| Metric | Value |
|---|---|
| Avg salsa cups per taco order | 3.2 |
| Avg salsa cups per torta order | 2.4 |
| Taco orders per peak hour | 95 |
| Torta orders per peak hour | 60 |
| Total salsa cups per peak hour | 448 |
| Labor absorbed by cup assembly | 30-45 min |
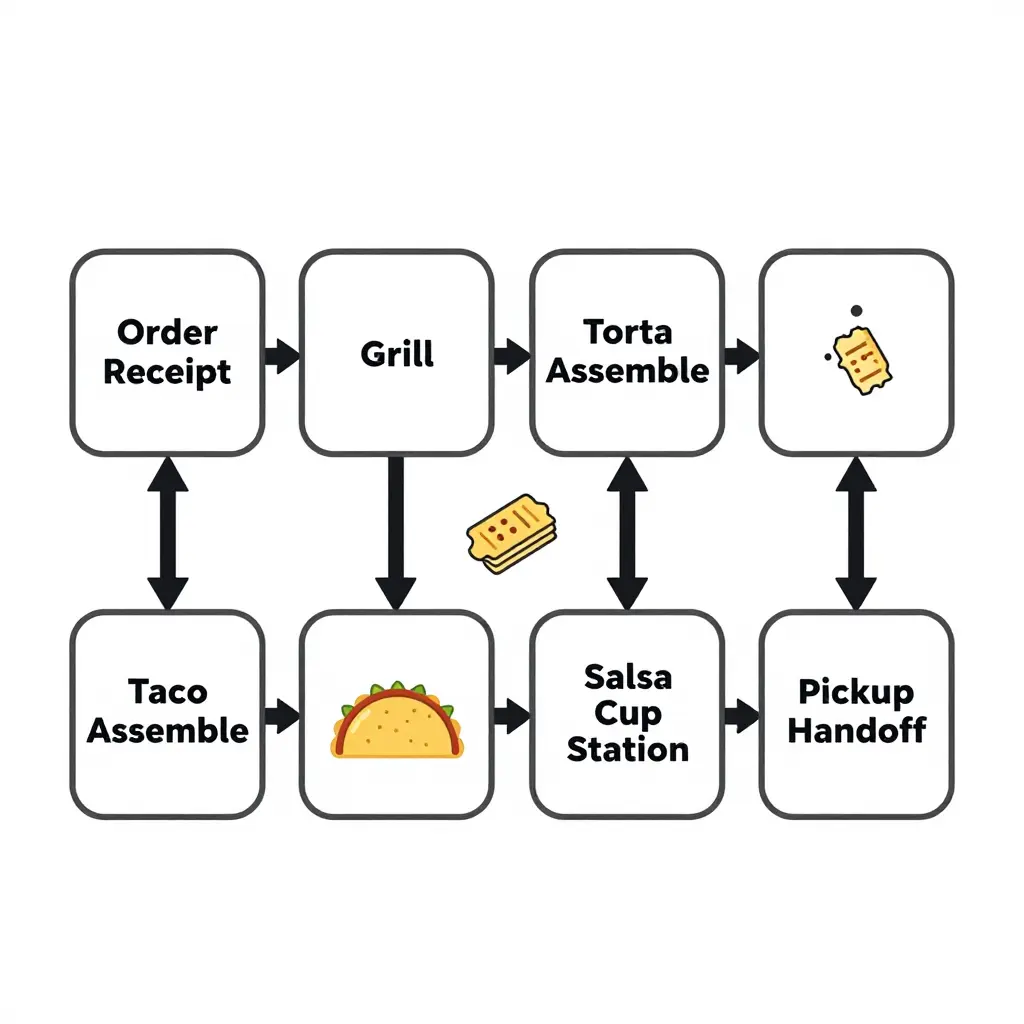
The diagram follows one online pickup ticket through El Canelo’s dinner service and marks where the queue stalls at 7pm.
Where the Kitchen Queue Stalls at 7pm
At 7pm, El Canelo’s online pickup orders run into walk-in traffic, and the ticket line stops behaving like a queue. Volume peaks, stations compete for the same flat-top and fryer, and small delays grow downstream. Taco orders, torta orders, and salsa cup counts together show where the line stalls and why one late station can push pickup times past the promised window at El Canelo’s online pickup operation.
- Grill (plancha) station: taco orders dominate the 7pm mix, and every protein batch competes for the same flat-top. When taco volume doubles, sear time per ticket climbs, and the grill backs up first.
- Torta assembly: tortas need toasted bread, layered fillings, and a separate press cycle, roughly 2-3x the build time of a taco. A few torta tickets can stall the expo line.
- Salsa and cold prep: salsa cup counts climb with taco orders, often five to six cups for a family order. Filling cups by hand is simple but constant, and when staff split between cups and expo, the queue backs up.
- Expo and ticket rail: the rail shows the backlog. Once 12 or more open tickets stack up, runners can’t match bags to online pickup orders, and handoff time grows.
- Fryer and chips: chips, queso, and fried sides share one basket, so one large chip order can block tortilla warming and add time to the 7pm queue.
How the 7pm Backlog Builds
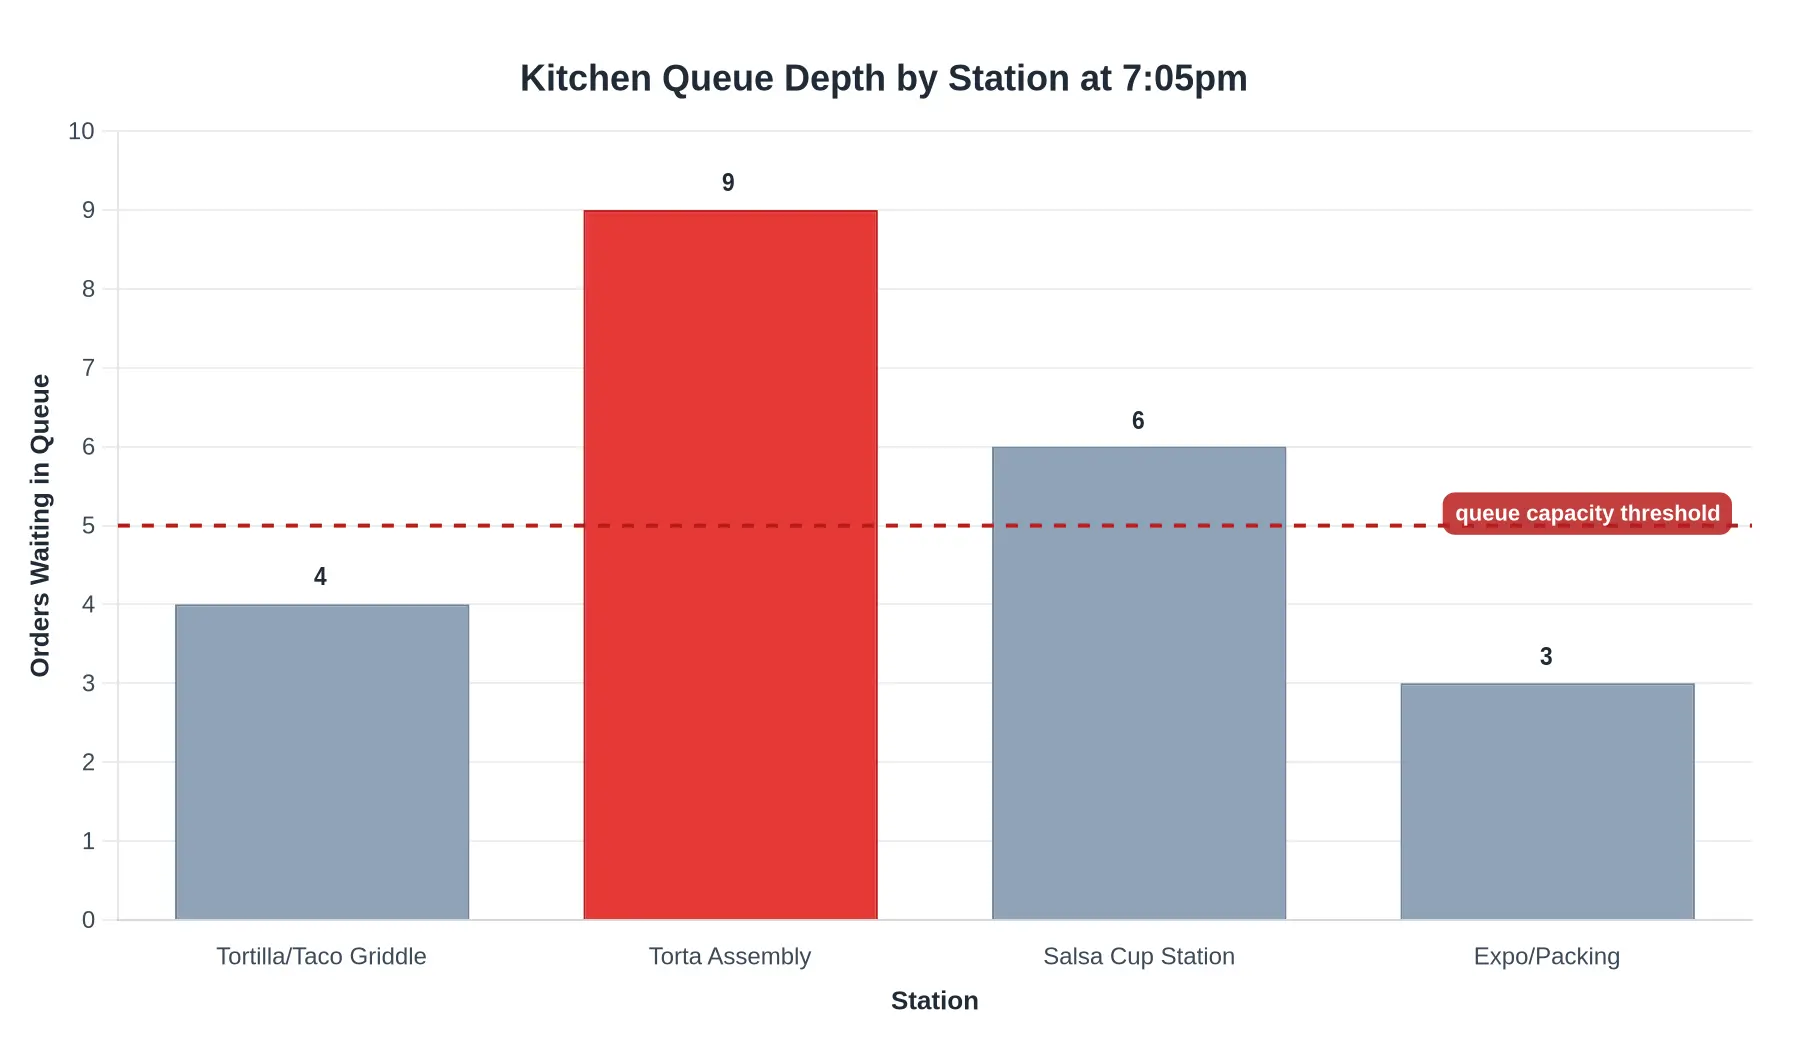
Between 6:50pm and 7:05pm, the kitchen queue turns from a manageable line into a backlog. The timestamps point to torta assembly.
At 6:45pm, throughput looks healthy. Taco orders clear in 1.8 minutes per ticket, the tortilla griddle holds a queue depth of 2, and fulfillment runs smoothly.
By 6:55pm, taco orders spike to 11 tickets in ten minutes, griddle time stretches to 2.6 minutes per ticket, and queue depth reaches 4. Most taquerias absorb a bump like that during peak dinner hours.
At 7:00pm, 9 torta orders arrive in the same window, and each one needs 3.4 minutes of layered assembly, toasting, and wrapping. That is where the line seizes.
By 7:05pm, salsa cups add to it. At roughly 6 cups per order, the relish station has to fill 54 cups in five minutes, which pulls a prep hand off torta assembly.
By 7:10pm the cumulative delay reaches 6.5 minutes and keeps climbing. The problem isn’t order volume by itself: it’s torta assembly and salsa cup filling colliding at one station staffed by two workers. Batching salsa cups before the rush would save roughly 4 minutes per torta ticket.
Which Station Holds the Queue at 7PM
Wait time rarely spreads evenly across the kitchen at 7PM. Timing each station during a peak-hour sample of online orders shows how the queue is distributed. To see how the front-of-house and pickup flow feed the bottleneck, it helps to know how the El Canelo kitchen and ordering operation is structured.
The doughnut chart splits the full 100% of peak-hour queue time across the five core stations. The grill takes the largest slice.
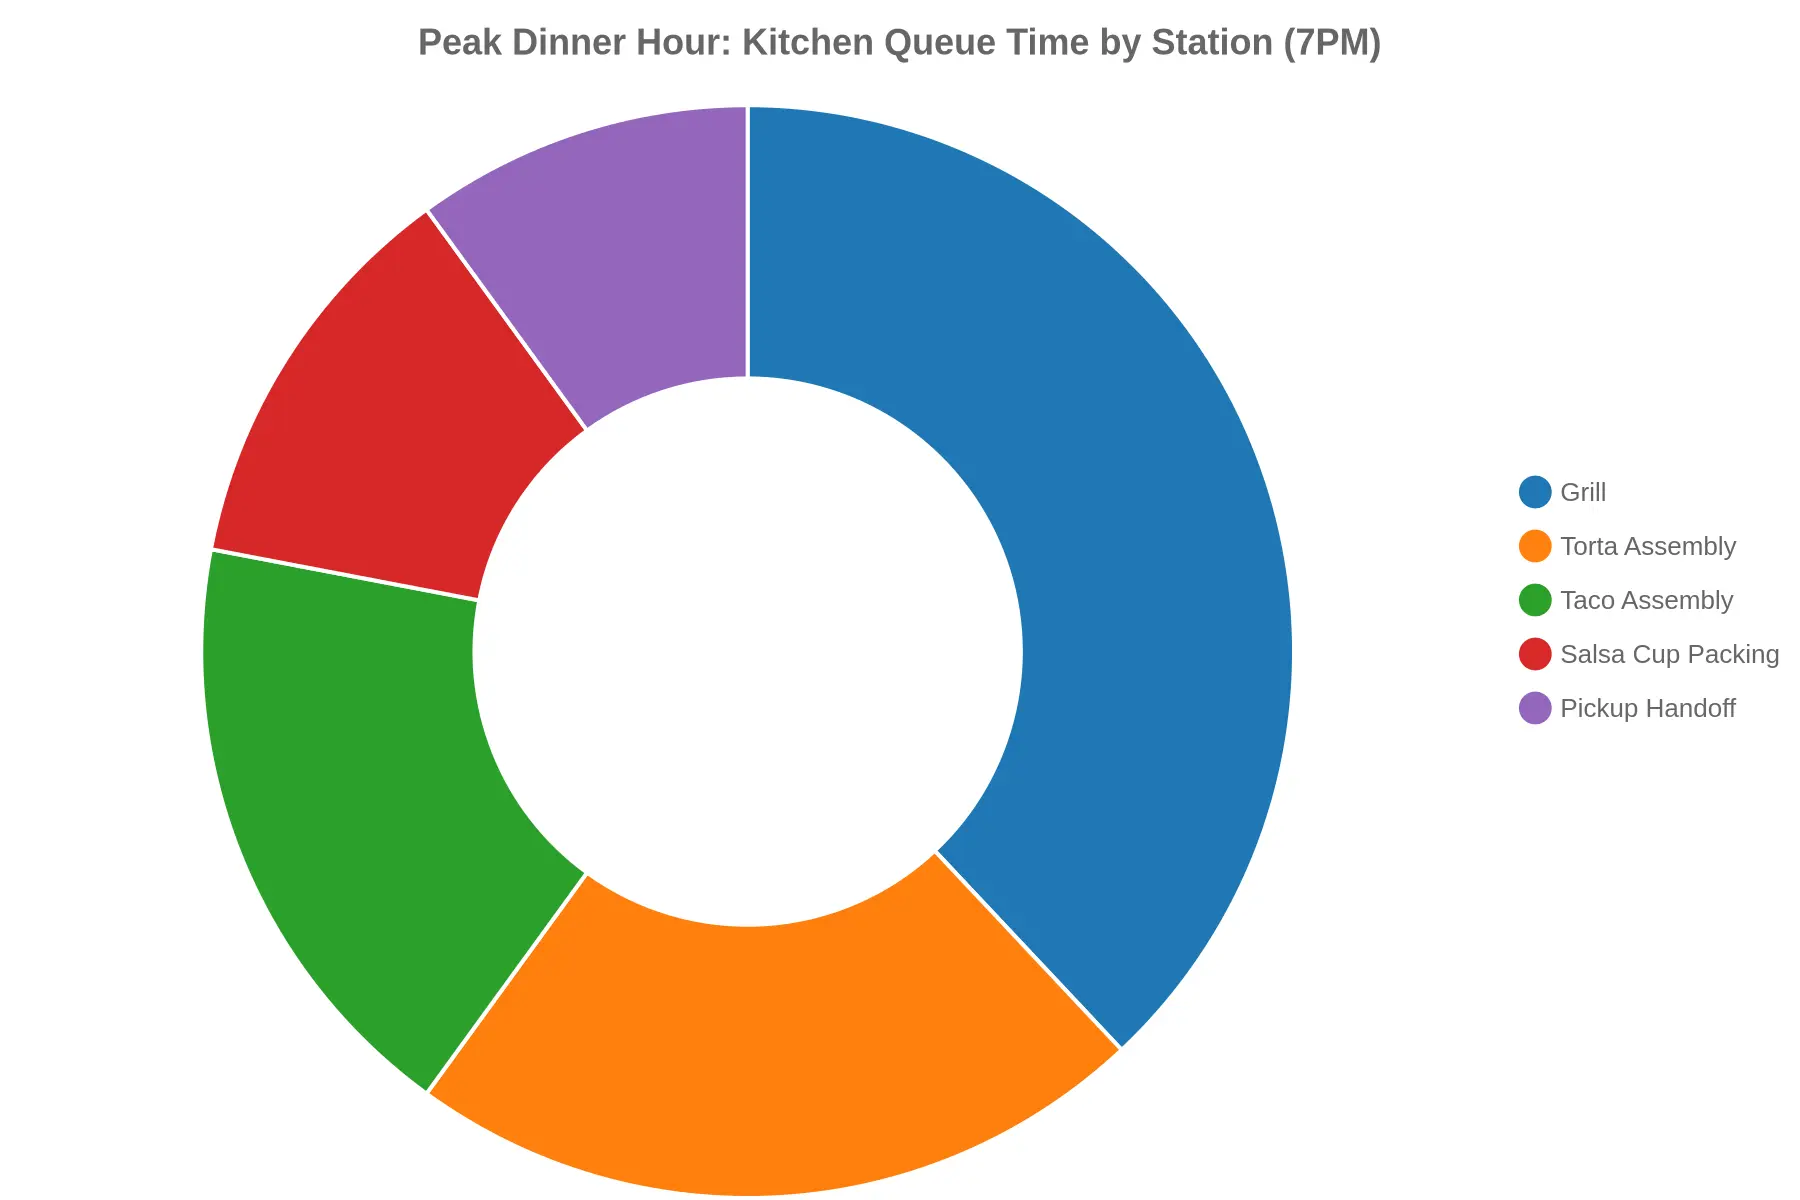
Figure 1. Peak dinner hour (7PM) queue time by station, as a share of total wait time.
| Kitchen Station | Share of Total Queue Time |
|---|---|
| Grill | 38% |
| Torta Assembly | 22% |
| Taco Assembly | 18% |
| Salsa Cup Packing | 12% |
| Pickup Handoff | 10% |
| Total | 100% |
At 38%, the grill holds the largest share of queue time. Torta and taco orders both send their protein through that one station, so a backlog there feeds straight into assembly, salsa cups, and pickup handoffs.
FAQ: Online Pickup and Dinner-Rush Operations
How many salsa cups does a typical taco order or torta order carry?
A three-taco order ships with two 2-ounce salsa cups; a torta order carries one cup plus pickled jalapeños. Platters of six or more tacos default to four cups. Together they account for roughly 30% of small-ware volume during peak dinner hours.
Why does the kitchen queue stall at 7pm?
At 7pm, online pickup and walk-in tickets converge, and more than 12 can be open at once. The grill station becomes the bottleneck, griddling only 18 torta rolls per 10 minutes. Past six stacked tickets, times climb from 6 minutes to more than 14.
How do taco and torta orders differ in prep time?
Taco orders assemble in 45-60 seconds once the proteins are ready, because tortillas and fillings are prepped in batches. Torta orders take 3-4 minutes, since each roll is griddled to order and layered with beans, avocado, and meat. That gap is what lets a wave of tortas delay taco tickets.
What can managers adjust to smooth order fulfillment?
Stagger online pickup slots at 10-minute intervals and cap torta orders at four per window. Pre-portioning salsa cups and pre-griddling torta rolls before 6:45pm cuts assembly time by about 20%. A dedicated expo runner keeps digital and walk-in tickets from colliding.
When should prep for peak dinner hours start?
Start batch prep at 5:30pm, staging 40 taco proteins and 15 torta rolls before the 7pm rush. Comparing salsa cup counts against order history prevents mid-rush stockouts, and a weekly review of queue timing helps tune staffing.
Operational Takeaways: What the Dinner Data Tells You
The data shows one pattern: taco and torta orders behave differently under pressure, and that difference shapes the pickup flow at peak. Taco tickets arrive in tighter clusters and produce many small items; torta orders take longer and depend more on individual stations. Salsa cup counts follow the same split, since high-cup orders tend to be larger taco bundles, which adds a prep step that grows with the rush. The 7pm stall is a sequencing problem as much as a volume problem: grill tickets and assembly tickets collide when fulfillment isn’t staged.
For owners and managers, the fixes are practical:
- Stage salsa cups and cold prep ahead of the 7pm window rather than assembling them to order.
- Staff the grill station as a dedicated lane during peak dinner hours, separate from assembly.
- Sequence online pickup orders by station load, not just by check-in time, to keep the queue from stacking.
- Batch torta orders to run parallel to taco output instead of competing for the same cook.
Regional menus matter here. A Veracruz Restaurant lineup leans on seafood builds that need early prep, while an Oaxacan Restaurant menu adds slower mole-based assemblies. Matching station staffing to those demands keeps fulfillment steady through the 7pm bottleneck.